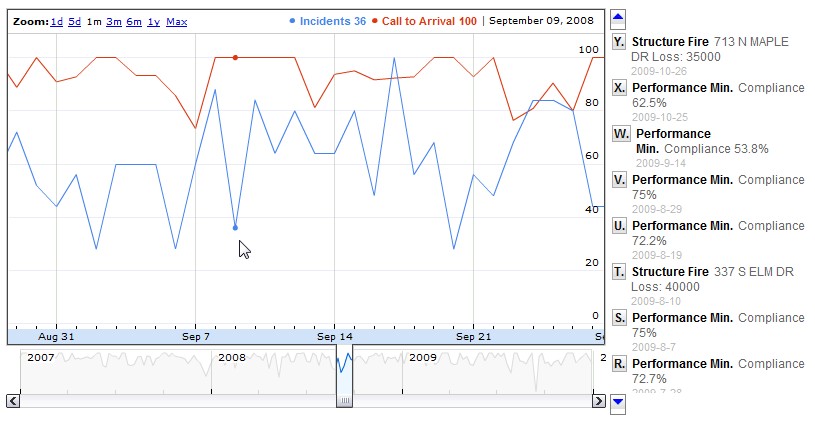
Another time analyzer calculation displayed on the web is called a timeline. Press the "Web Timelines" button to begin.
![]()
At the Operations Window press the Incidents button. Select records for one year. Now click on the Reporting Options bar and select the Time Analyzer. Press the "Web Timeline" button on the far right. Setup your screen so it looks like this:

Now press the "Process Text" button to create the graph.
Web Timeline Example
The Web Timeline is automatically created as an HTML document. You can view it locally by pressing the Open HTML browser. Most likely you will have to disable security options in order to view the interactive graph from your local drive.
Remember, this graph is designed for web site. It may not display all of it's features if opened from a local drive.
Here's an example graph:
