There's nothing like a spreadsheet when you want to crunch the numbers. But most spreadsheets are fairly static. You can enter new values and see new results, but it's difficult to order the numbers quickly to search out trends. That's why NFIRS 5 Alive includes Dynamic Numeric Displays.
Here's an example:
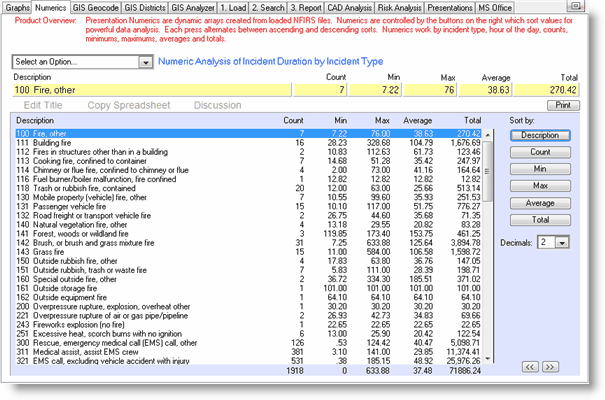
The title of the display appears at the top in blue. Notice you can move the blue highlight to any row you wish. As the highlight moves the values in the row are copied into the enlarged yellow fields at the top of the display. This feature makes it possible for numeric displays to be included as key elements of your presentation.
The "Select an Option..." drop-down list provides many of the same options found in animated graphs as well as the ability to convert this numeric into a format suitable for pasting into an Excel spreadsheet.
The "Sort by" buttons on the right instantly sort the graph as indicated. Press once for an ascending sort. Press the same button again for a descending sort. Notice you may adjust the number of decimals. While this is not a feature you would use with "counts", it is very useful when displaying averages.
Notice the totals are calculated and displayed at the bottom of the numeric. This keeps the numbers above in perspective.
The "<<" and ">>" button move you from numeric display to another. As in animated graphs, it's like moving to the next topic in a slide presentation. This button functionality is duplicated in Presentations where by clicking on the right side of the report title you move to the next topic. By clicking on the left side of the report topic you move to the previous topic. During presentations you don't have to locate small buttons. Just click on one side of the title.
If you want your numeric on paper press the "Print" button. NFIRS 5 Alive provides a powerful summary of the numbers in the "sort by" order you have selected.