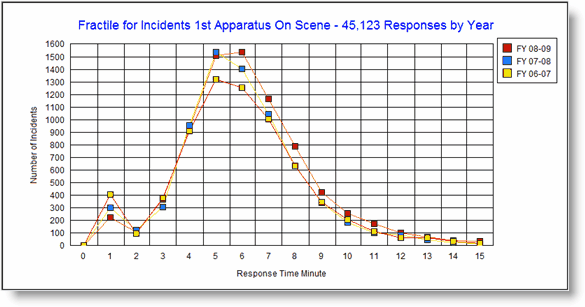
Fire standards have evolved. New standards such as Accreditation, Standard of Cover (SOC), NFPA 1710 / 1720 require fractile and compliance measurements. These new measurements highlight not only demand, but fire department response to demand.
In the fractile graph example below notice how the number of incidents (demand) is increasing each year. But also notice how the increase is mainly in incidents where the first apparatus to arrive on the scene arrives in 6, 7, 8 and 9 minutes. This is not a good trend. It indicates increasing in demand from more remote locations.

NFIRS 5 Alive provides dozens of fractile measurements that can be broken down by year, fiscal year, shift, time of day, etc.
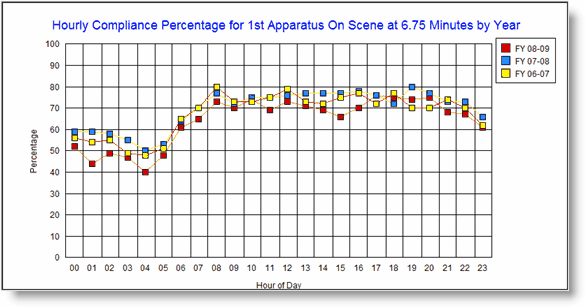
In addition to fractiles fire departments today need to set performance goals and measure their compliance with the standards they set. NFPA 1710 and 1720 focus on the percentage of time certain performance goals are met. Let's see another real-world graph.
Compliance graphs measure compliance with a stated goal. Here a goal for the first apparatus to arrive on the scene in 6.75 minutes was selected and run for more than 45,000 records. Notice how performance is worse in the early morning hours. But also notice early morning performance was worse in the most recent year. Again, the trend needs attention.

Compliance graphs always measure percentage from 0 to 100%, but many different breakdowns and goals can be selected.
Minutes to Seconds
Early in 2010 national standards dropped response time analysis based on minutes if favor of seconds. Seconds are far more accurate. Seconds also eliminates the use of fractional minutes to express response times.
While the old minute goals may seem familiar, the new second goals will make measurements more precise:
Response Time Measurement Old Minute Goal New Second Goal
Call Processing 1 60
Turnout 1.5 90
Travel 4 240
Call to Arrival 6.5 390
NFPA 1710 / 1720
NFIRS 5 Alive provides a single push-button NFPA 1710 report. Go to the "Time Analyzer". Press one button to perform all related calculations in just a few minutes. Here's an example using sample data:
Deployment Delivery & Response Time Objectives Compliance Report
Number of Incidents Examined: 17,961
Number of Incidents within Jurisdiction: 17,215
Number of Structure Fires & EMS Incidents: 8,725
Number of Structure Fires: 75
Number of Structure Fires with a full response: 59
Number of EMS Incidents: 8,688
Number of EMS Incidents with ALS response: 0
Call to Arrival Compliance Calculations for Structure Fires & EMS Incidents
0 - Number of incidents removed from calculation for a zero value: 34
0 - Number of incidents removed from calculation for a value greater than 300 seconds: 22
0 - Number of incidents tested for Call to Arrival Compliance: 8,707
0 - Call to Arrival Compliance at 390 seconds: 93.48% (8,140)
0 - Actual seconds required to reach 90% compliance for Call to Arrival objective of 390 seconds: 361
Call Processing Compliance Calculations for Structure Fires & EMS Incidents
0 - Number of incidents removed from calculation for a zero value: 34
0 - Number of incidents removed from calculation for a value greater than 300 seconds: 4
0 - Number of incidents tested for Call Processing Compliance: 8,725
0 - Call Processing Compliance at 60 seconds: 97.88% (8,540)
0 - Actual seconds required to reach 90% compliance for Call Processing objective of 60 seconds: 31
Turnout Time Compliance Calculations for Structure Fires & EMS Incidents
0 - Number of incidents removed from calculation for a zero value: 107
0 - Number of incidents removed from calculation for a value greater than 300 seconds: 218
1 - Number of incidents tested for Turnout Time Compliance: 8,438
1 - Turnout Time Compliance at 90 seconds: 23.95% (2,021)
1 - Actual seconds required to reach 90% compliance with turnout objective of 90 seconds: 196
Travel Time Compliance Calculations for Structure Fires & EMS Incidents
0 - Number of incidents removed from calculation for a zero value: 1,307
0 - Number of incidents removed from calculation for a value greater than 900 seconds: 21
1 - Number of incidents tested for Travel Time Compliance: 7,435
1 - Travel Time Compliance at 240 seconds: 93.41% (6,945)
1 - Actual seconds required to reach 90% compliance with travel objective of 240 seconds: 216
Structure Fire Compliance Calculations
2 - Actual seconds required to reach 90% compliance for first unit Travel Time objective of 240 seconds: 311
2 - Number of Structure Fires tested for 4-F/f personnel compliance: 75
2A - Compliance for 4-fire fighters on-scene in 240 seconds travel time: 84.00% (63)
2 - Number of Structure Fires tested for 13 / 14 compliance: 59
2B - Compliance for full assignment (13 / 14 F/f's) on-scene in 480 seconds travel time: 49.15% (29)
EMS Compliance Calculations
3 - Number of EMS incidents tested for BLS Compliance: 8,688
3 - BLS capability on scene in 240 seconds travel time: .00% (0)
3 - Actual seconds required to reach 90% compliance for BLS Travel Time objective of 240 seconds: 327
4 - Note: It appears ALS capabilities were not set in (Jurisdiction button to) Vehicles area.