The Time Analyzer is certainly not restricted to text or spreadsheet analysis. Locate the graph buttons in the lower portion of the Time Analyzer. Press the "Fractile Graphs" button. This is the main area for distribution and concentration analysis.
![]()
Here you see an area used to select fractile and compliance graphs.
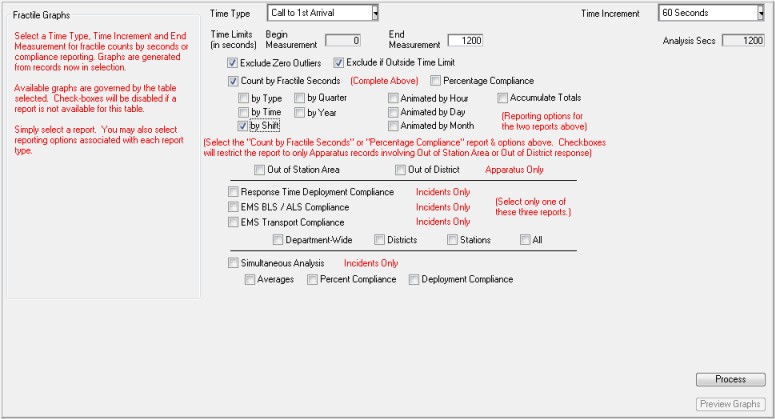
Notice graphs can illustrate fractile trends as well as compliance. Compliance shows the percentage of times responses meet a minute goal. For example, if your goal is to have a company on the scene within 6 minutes, a compliance graph can measure the percentage of compliance for that goal:
By Incident Type
By 6-Hour Time Segment
By Shift
By Quarter
By Year
Note: If you enter the Time Analyzer from the Apparatus module you will see the option to plot performance by arrival sequence. This feature is especially useful for concentration analysis.
Graphs may also be animated by:
By Hour of the Day (24)
By Day of Week (7)
By Month of Year (12)
A variety of other graphs may also be produced and sent to Presentations for storage and display.
Press the "Process" button to process the report you select. You may then preview your report by pressing the "Preview Graphs" button. All reports are automatically copied into the Presentations module.