The Time Analyzer has other powerful calculation features. Just press a button to access the calculation feature you want.
![]()
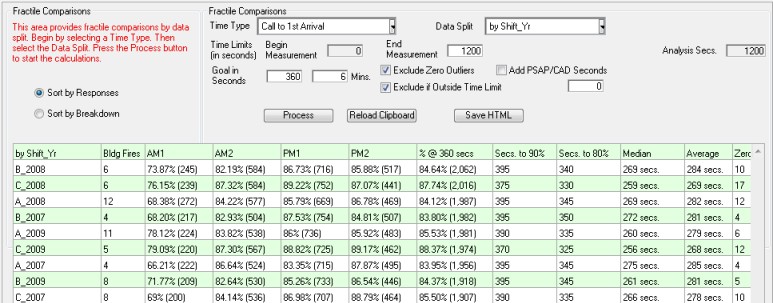
When you want a high-power fractile comparison press the "Comparisons" button. This area supports both distribution and concentration analysis.
Here is a distribution comparison of Call to 1st Arrival performance by Shift broken-down by year. The shift and year with the greatest number of responses is listed first. A goal of 360 seconds (6-minutes) was selected. Notice this "Comparisons" area breaks-down performance into four 6-hour time segments for early morning, morning, early afternoon and evening hours. The percent compliance is listed followed by the number of incidents in parenthesis.
Once processed these statistics are automatically copied into the clipboard for pasting into cell A1 of any spreadsheet application. In addition, you have the option of creating and publishing HTML tables containing the same data.
If you select the "by D3 District" Data Split you will be given the option to create a KML map file that puts comparison data on Google Earth or other KML enabled geographic system.