Graphs and Animated Graphs created by the NFIRS 5 Alive reporting process will automatically appear in Presentations. If you gave selected reports a "Group Name" before processing, that Group Name will appear in the list of Presentations.
When a presentation has loaded properly a graph will appear when you double-click to open it. If you press the Data button you will be taken to the data entry area where you have the option of editing the title of the graph or adding an analysis description.
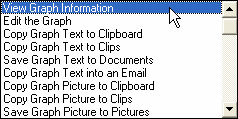
Each animated graph has the following options:

"View Graph Information" allows you to view information about the graph's creator, the date and time of creation as well as any analysis description that was provided with the graph.
If you select "Edit the Graph" you may change the style of the graph. For example, you can change the graph from a 3D Column Graph to a 3D Line Graph. You can also edit the legend numbers and resort the graph display. Any changes you make will be saved with the graph when it is viewed in the future.
"Copy Graph Text to Clipboard" copies the NFIRS 5 Alive text format for this graph to the clipboard. The text formatting is all you need to recreate the graph in any version of NFIRS 5 Alive.
The graph text may also be copied to Clips using the "Copy Graph Text to Clips" option.
You may "Save Graph Text to Documents". This simply creates a new Documents record to store the graph text.
For easy sharing of your graphs you can select "Copy Graph Text to an Email". This option automatically brings up the NFIRS 5 Alive Email Editor pre-loaded with the graph text and instructions for viewing the graph.
You can also make a picture of a graph and copy it to the Clipboard, Clips or into a Picture record. Graph pictures can be read to the Clipboard and pasted into Microsoft Office applications.
Graph options also provide the ability to "View Clipboard" and "View Clips".