Click on the "Numeric" report generator button. You will not see any formats listed. You will see several buttons representing NFIRS 5 Alive tables. If you click on a table button you will then see a list of report formats for that table. Here we've selected the Incidents table, "Numeric Analysis of Duration by Station".

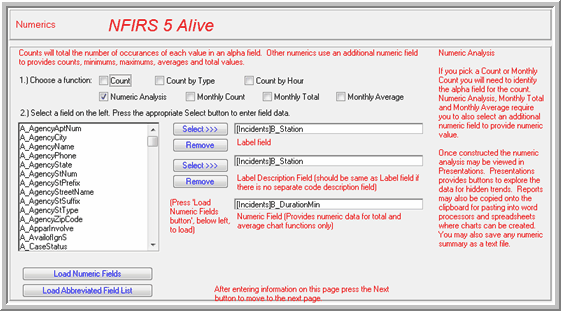
1. Select a numeric function. "Count" is just a simple count. "Count by Type" breaks down count by incident type; Fire, EMS or Other. "Count by Hour" breaks down the count into six hour blocks. A "Numeric Analysis" provides the count, minimum, maximum and average. The remaining monthly reports provide counts, totals and averages by month.
2. Field selection works just like in a Graph report. Select the field you wish to analyze by clicking once on the field title. Notice the letter in front of the field title. The letter is used in the Incidents table to identify the module. For example, "B" for Basic, "A" for Arson, "F" is for Fire, "S" is for Structure Fire, "HM" for Hazmat, etc. Click once on the field you wish to analyze. Now press the Select button to automatically copy the field over into the field areas on the right. Notice there are two fields. If you have a field like Census Tract the same field title is used in both fields. But if you have a field that has a description associated with it, the description field should be identified in the second field. In Incidents this is generally handled automatically. In other modules you may need to select two fields from the list, the coded field first, then the description field. Below the list of fields you will see two buttons. If you have not selected a "count" NFIRS 5 Alive needs to know the field to look to for a value. You can load a list of numeric fields by pressing the "Load Numeric Fields" button. Use the "Select" button to automatically copy over a numeric field into the Numeric Field area. The "Load Abbreviated Field List" button allows you to narrow down the list of displayed fields to those you have selected for searching. This can be a real time saver as your focus on key fields only.

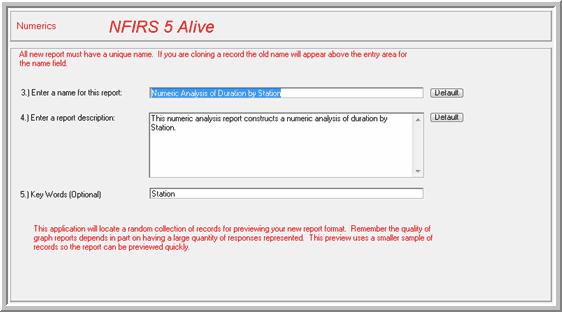
3. Enter a name for the report. It is recommended you press the "Default" button to have NFIRS 5 Alive select the name. Check the name carefully and correct any errors or add any missing spaces.
4. NFIRS 5 Alive can also automatically create a report description by pressing the "Default" button.
5. Add any Key Words you wish. You can use these key words to help you locate reports.
To see a preview of your report press the Preview button. It's recommended you allow NFIRS 5 Alive to select a small number of random records to test your report. Once your test report is processed it will be displayed.

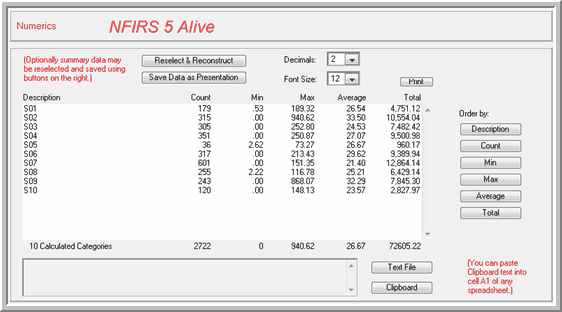
Let's look at the small sample of records that was used to create this chart. First, you have the option of rerunning the report with a different selection of incidents. You can save the report as a Presentation if you wish. You can change the number of decimals or font size for presentation purposes.
You can sort the numeric any way you wish. Then you can send the chart to the printer by pressing the "Print" button.
Let's say you've created a much larger report from a much larger selection of records. You may then press the "Text File" button to convert the report into a tab delimited text document that can be opened by a word processor or a spreadsheet application. If you choose you can have the text copied to the clipboard so you may paste it into cell A1 of any new spreadsheet document.
A numeric report is powerful. It also provides an excellent method data mining NFIRS 5 incident files.