The Time Analyzer is used to measure fire department operations related to time. In the past a simple statistic like "Average Response Time" was considered adequate for describing the operational service levels. But this simple statistic provides too little useful information.
Contemporary fire department performance measurements utilize fractiles and compliance testing. The Time Analyzer uses fractiles and compliance testing to support advanced distribution and concentration measurements. These measurements focus on specific operational components:
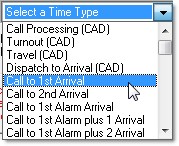
1. Call Processing / Call Handling Time (The time it takes the dispatcher to receive, process and dispatch ("tone-out") appropriate companies.) -CAD Data Required-
2. Turnout Time (The time measured from dispatch until the company begins traveling to the scene.) -CAD Data Required-
3. Travel Time (The time it takes companies to travel from their location at dispatch to the scene of the emergency.) -CAD Data Required-
4. Dispatch to Arrival (The time from a company being notified of the location of an emergency until the company arrives on the scene.)
5. Call to 1st Arrival (The time that passes from the time the dispatch center receives a call for assistance until the first company arrives on the scene.)
6. Call to 2nd Arrival (The time that passes from the time the dispatch center receives a call for assistance until the second company arrives on the scene.)
7. Call to 1st Alarm Arrival (The time that passes from the time the dispatch center receives a call for assistance until the first alarm assignment arrives on the scene.)
8. Call to 1st Alarm plus 1 Arrival (The time that passes from the time the dispatch center receives a call for assistance until the first alarm plus one additional apparatus arrives on the scene.)
9. Call to 1st Alarm plus 2 Arrival (The time that passes from the time the dispatch center receives a call for assistance until the first alarm plus two additional apparatus arrives on the scene.)
10. Scene Duration (The amount of time it takes to handle the emergency from the time the company arrives on the scene until the company is clear.)
11. Total Duration (The time that passes from the time the dispatch center receives a
call for assistance until the company is clear.)
These time components precisely describe each phase of fire department operations. Notice the first three components require data not traced in NFIRS 5 but available in CAD data. This is why NFIRS 5 Alive has been designed with a programmable CAD interface.
You can merge CAD data with your NFIRS 5 incidents to accurately measure CAD-related components of response time. If CAD data is not available you can still measure Response Time, Scene Duration and Total Duration.
Once the time components have been described averages can be calculated for each component. The problem is, however, averages are deceptive. One or two unusual response times can skew an average. A better approach is to establish a "median". A median is simply ordering a response criteria by time then selecting the value that falls in the middle. This method eliminates any extreme values and provides a much more stable and accurate representation of fire department response patterns.
Despite the fact that calculating medians is a better method for measuring operations, it is not a measure commonly used today. A new method called "fractile analysis" is now used to measure operational responsiveness. Like determining a median, fractile analysis orders response time. But it takes a step further by providing an incident count for each division of time. So if a time division is one minute, fractile analysis will provide an incident count for incidents with a response time of one minute or less, greater than one minute but not more than two, greater than two but not more than three, etc.
When printed in text or plotted on a graph these fractile counts provide a great deal of information about response patterns. This is especially true when animated by hour of the day, day of the week or by month.
A type of fractile analysis is called "Compliance" testing. "Compliance" requires the fire department to create a goal. Compliance determines the percentage of incidents meeting the goal.
Here's an example. Let's take the goal of having the first apparatus arrive on the scene in 6 minutes or less. A compliance report can look at a 24-hour day and within each hourly segment plot the percentage of incidents meeting that goal from 0% to 100%. Again we see a very revealing graph illustrating the strengths and weaknesses of fire department response over a 24-hour period.
Both fractile analysis and compliance testing are types of measurements used by NFPA 1710 and NFPA 1720 to describe standards for fire department responses.
Here's how NFIRS 5 Alive performs these measurements. The user simply enters a begin time, an end time and an "interval". For example, if you wish to examine response time you can enter a begin time of 0 minutes and an end time of 8 minutes. You can then choose to see response time criteria displayed in intervals down to 15 seconds. The Time Analyzer will then tell you the number and percentage of responses that had a response time equal to 00:00, a response time less than or equal to 00:15, a response time less than or equal to 00:30, a response time less than or equal to 00:45, etc.
As the Time Analyzer increments the amount of time you see the number and percentage of responses grow. This provides a dynamic view of the distribution of responses over a defined range of operational criteria.
In addition to these text measurements NFIRS 5 Alive also provides easy to access fractile and compliance graphs.