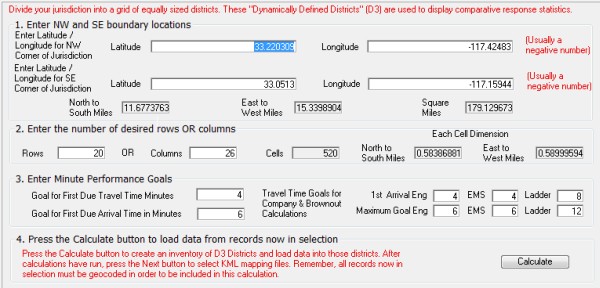
If you enter the GIS Analyzer from the Apparatus module you will see additional reporting options under D3 Districts.
You have the ability to define travel time performance goals as part of the D3 District setup. Follow the instructions on the screen.

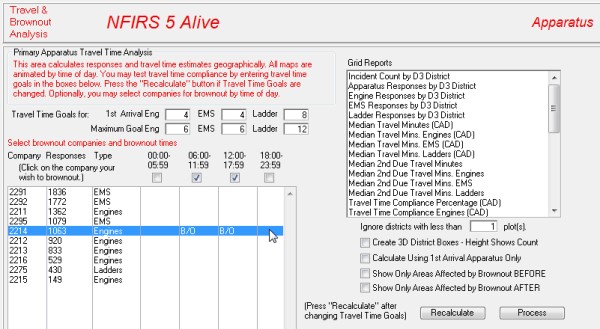
After calculations have been made press the "Travel Time & Brownouts" button. This area allows you to create many maps illustrating travel time performance. By eliminating the contributions of one of more companies for one or more time periods it's possible to create animated maps that illustrate the effect of company brownouts on travel time performance.

In the left scrolling list click on the companies you wish to brownout. Check the brownout time periods in the check boxes above. On the right select the map you wish to construct. You may select options to 1.) ignore inactive districts, 2.) create 3D boxes using height to show activity, 3.) calculate travel times for first arriving apparatus only, 4.) show only areas affected by brownout before the brownout or 5.) show only areas affected by the brownout after the brownout takes place.
All travel time estimates are based on past performance data.