Once you have completed a Jurisdictional profile you can create statistical data in the form of spreadsheets and maps. Here's how it works.
Click on one of the tabs at the top of the Jurisdiction dialog. Here we've clicked on Distribution Spreadsheets and Maps. Follow the instructions on the screen to identify 90% Travel Time by Station.
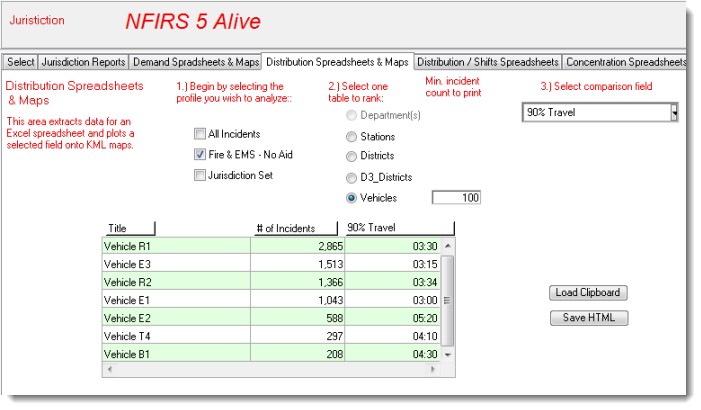
You can order by any column by simply clicking on the button at the top of the column you wish to sort. At this point you can load the clipboard to transfer the 90% travel time data to a spreadsheet or press the Save HTML button to create an HTML document that puts the data on the web.
To map 90% travel time data simply press the "D3_Districts" radio button and then reselect "90% Travel" in step #3. You will now see a "Plot D3 Comparisons to D3 Map" button. Press the button and a KML file will be created for viewing in Google Earth or other KML enabled software.