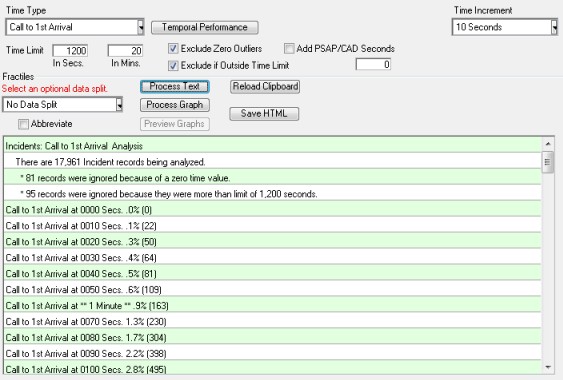
Let's enter a specific example.
Call to 1st Arrival (Distribution) is being measured from 0 to 20 minutes (1,200 seconds) in 10 second intervals. Once you have entered the required parameters, press the Process button to create and populate the criteria you selected.
Here 17,961 incidents are ranked by 10-second segments. This report was processed in just a few seconds. Notice 81 records had a zero second Call to 1st Arrival and were ignored. Also ignored were 95 records indicating Call to 1st Arrival times greater than 1,200 seconds. If 911 calls are received by another agency the application provides the ability to add PSAP CAD seconds. Once options have been set simply press the "Process Text" button to perform the calculation.
The above calculations are for all incidents. But a new "Data Splits" feature (upper left side of layout) allows comparative calculations by scores of criteria. Here's essentially the same set of records split by Station for Stations 1, 2 & 3.
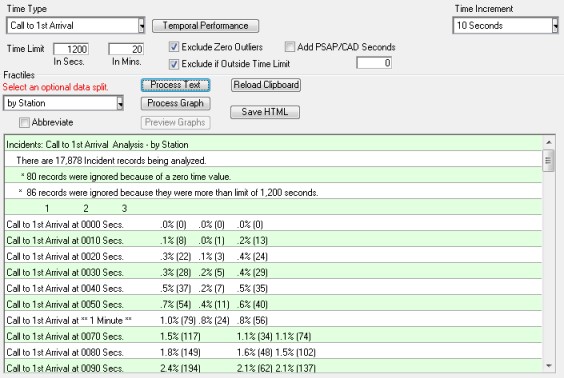
Because there's virtually no limit to the number of columns created by a data split the normal way to view a data split is via a spreadsheet application like Excel. Once you run the calculation the clipboard is automatically filled with spreadsheet data. Simply paste this data into cell A1 and you will see the data perfectly formatted for viewing in the spreadsheet.
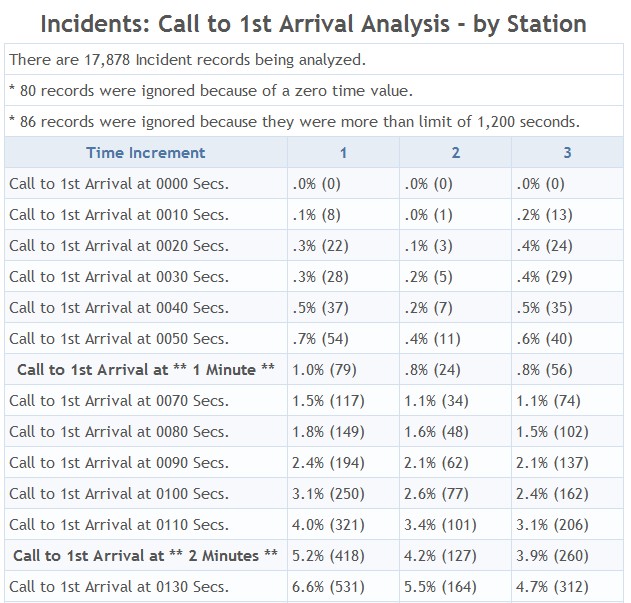
But there's another way to view data splits. Press the "Save HTML" button and an HTML table will be built to display the data. Press the "Open HTML" button to open the HTML table you created in your default web browser. Here's a sample of the HTML created in the Time Analyzer:
Once a Time Analysis has been processed NFIRS 5 Alive allows you several other options for your Time Analysis report. Using the "Select an Option" pop-up list you can:
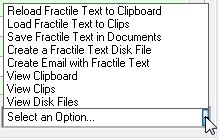
1. Reload fractile text to the clipboard.
2. Load fractile text into Clips.
3. Save the time text in the Documents module for later use.
4. Create a text file containing time text.
5. Create an email with the time text inserted in the body of the email.
You can quickly map fractile performance data by D3 District. Simply press the "Plot Type Type to D3 Map" button to send performance data to a KML file capable of being read by Google Earth or other KML enabled GIS systems.