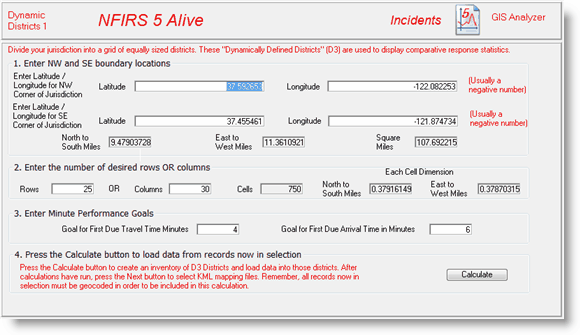
Dynamically Defined Districts, D3 Districts, is a "grid" of districts overlayed on a geographical area. When you press the button to enter the D3 District area the first thing you see is information about the grid of districts.

Notice the latitude and longitude of the NW corner of the jurisdiction is entered first. The next position entered is the SE corner of the jurisdiction. You can get these locations by opening Google Earth and moving the cursor over these positions. If you are unsure about the boundaries of your jurisdiction simply plot the icon location of 1,000 to 2,000 incidents. Click on the position of the NW corner of the incident icon cluster and enter the coordinates. Repeat to obtain and enter the coordinates of the SE corner.
When the coordinates are entered NFIRS 5 Alive calculates the size of the jurisdictional rectangle you've selected. You will also get a calculation for the number of square miles within the selected rectangle.
Now you need to enter the number of rows OR columns you want in your grid of cells. Generally, if you enter 25 rows NFIRS 5 Alive will calculate the number of columns needed to create nearly square grids. Cell calculations are then made and placed on the screen.
The next step is to add performance goals for first due apparatus travel time and first due apparatus response time. Then simply press the Calculate button and NFIRS 5 Alive will perform the following tasks:
All incidents will be assigned to a D3 district.
Performance measurements will be made for each D3 district
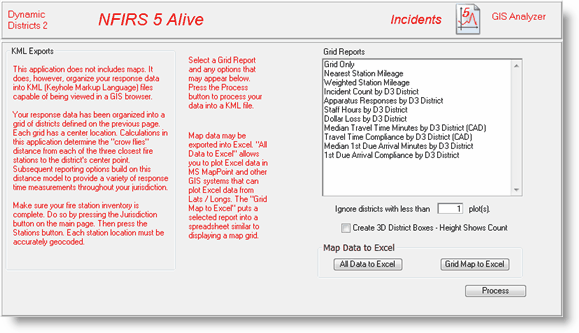
A set of mapping options will be displayed for selection
After the Calculations have been made press the "Next" button to move to select maps for display.

You have the option of disabling D3 Districts that have fewer than the specified number of incidents. You may also create 3D district boxes where the height of the box indicates the relative run activity of the district. This is one very powerful feature.
You also have the ability to export map data to Excel. If you press the "Grid Map to Excel" the data in the map you select will be available for pasting into Excel.
Any map created will appear in the Map folder. In Google Earth simply expand the File menu and select "Open". Open the new file in the Map folder.