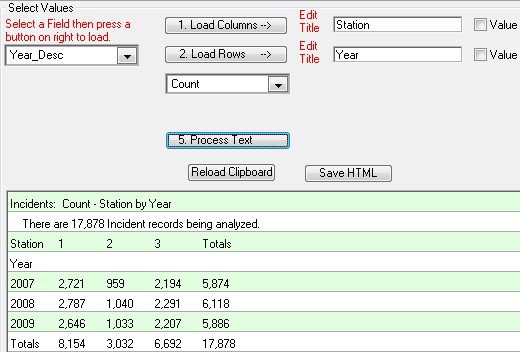
The simple example below was created from Incidents by selecting "B_Station" and then pressing the "Load Columns" button. Next "Year_Desc" was selected and then loaded into the rows by pressing the "Load Rows" button.
Count was selected to provide a count with sub-totals and totals. Next the "Process Text" button was pressed. Once the calculation appears on the screen it can be pasted directly into cell A1 in a spreadsheet application.

The Worksheet Analyzer enables you to create "Counts" and "Percentages" by comparing two fields. You can also create "Totals" by adding a numeric data field.
In addition to counts, totals and percentages the Worksheet Analyzer now supports 90% & 80% performance calculations. So it is now possible to show 90% Call to Arrival performance by incident type by station area.
Data Splits in the Worksheet Analyzer
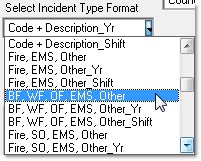
You also have the option of utilizing the power of data splits. If you select the "B_IncidentType" field and load it into a column or a row you will have the option of breaking down the incident type in dozens of ways. Just select the breakdown from the pop-up list that appears.
